What this is for#
Setting up the A/B test was the easy part (see A/B Test Campaigns). The hard part is reading the result correctly — knowing when "Variant A won by 23%" is signal vs noise, and what to test next based on the verdict.
This is the deep-dive on AcelleMail's A/B Report tab.
Where the report lives#
After the test audience portion has sent and the wait period (default 72h) has passed, AcelleMail auto-evaluates the winner and shows the A/B Report tab on the campaign overview.
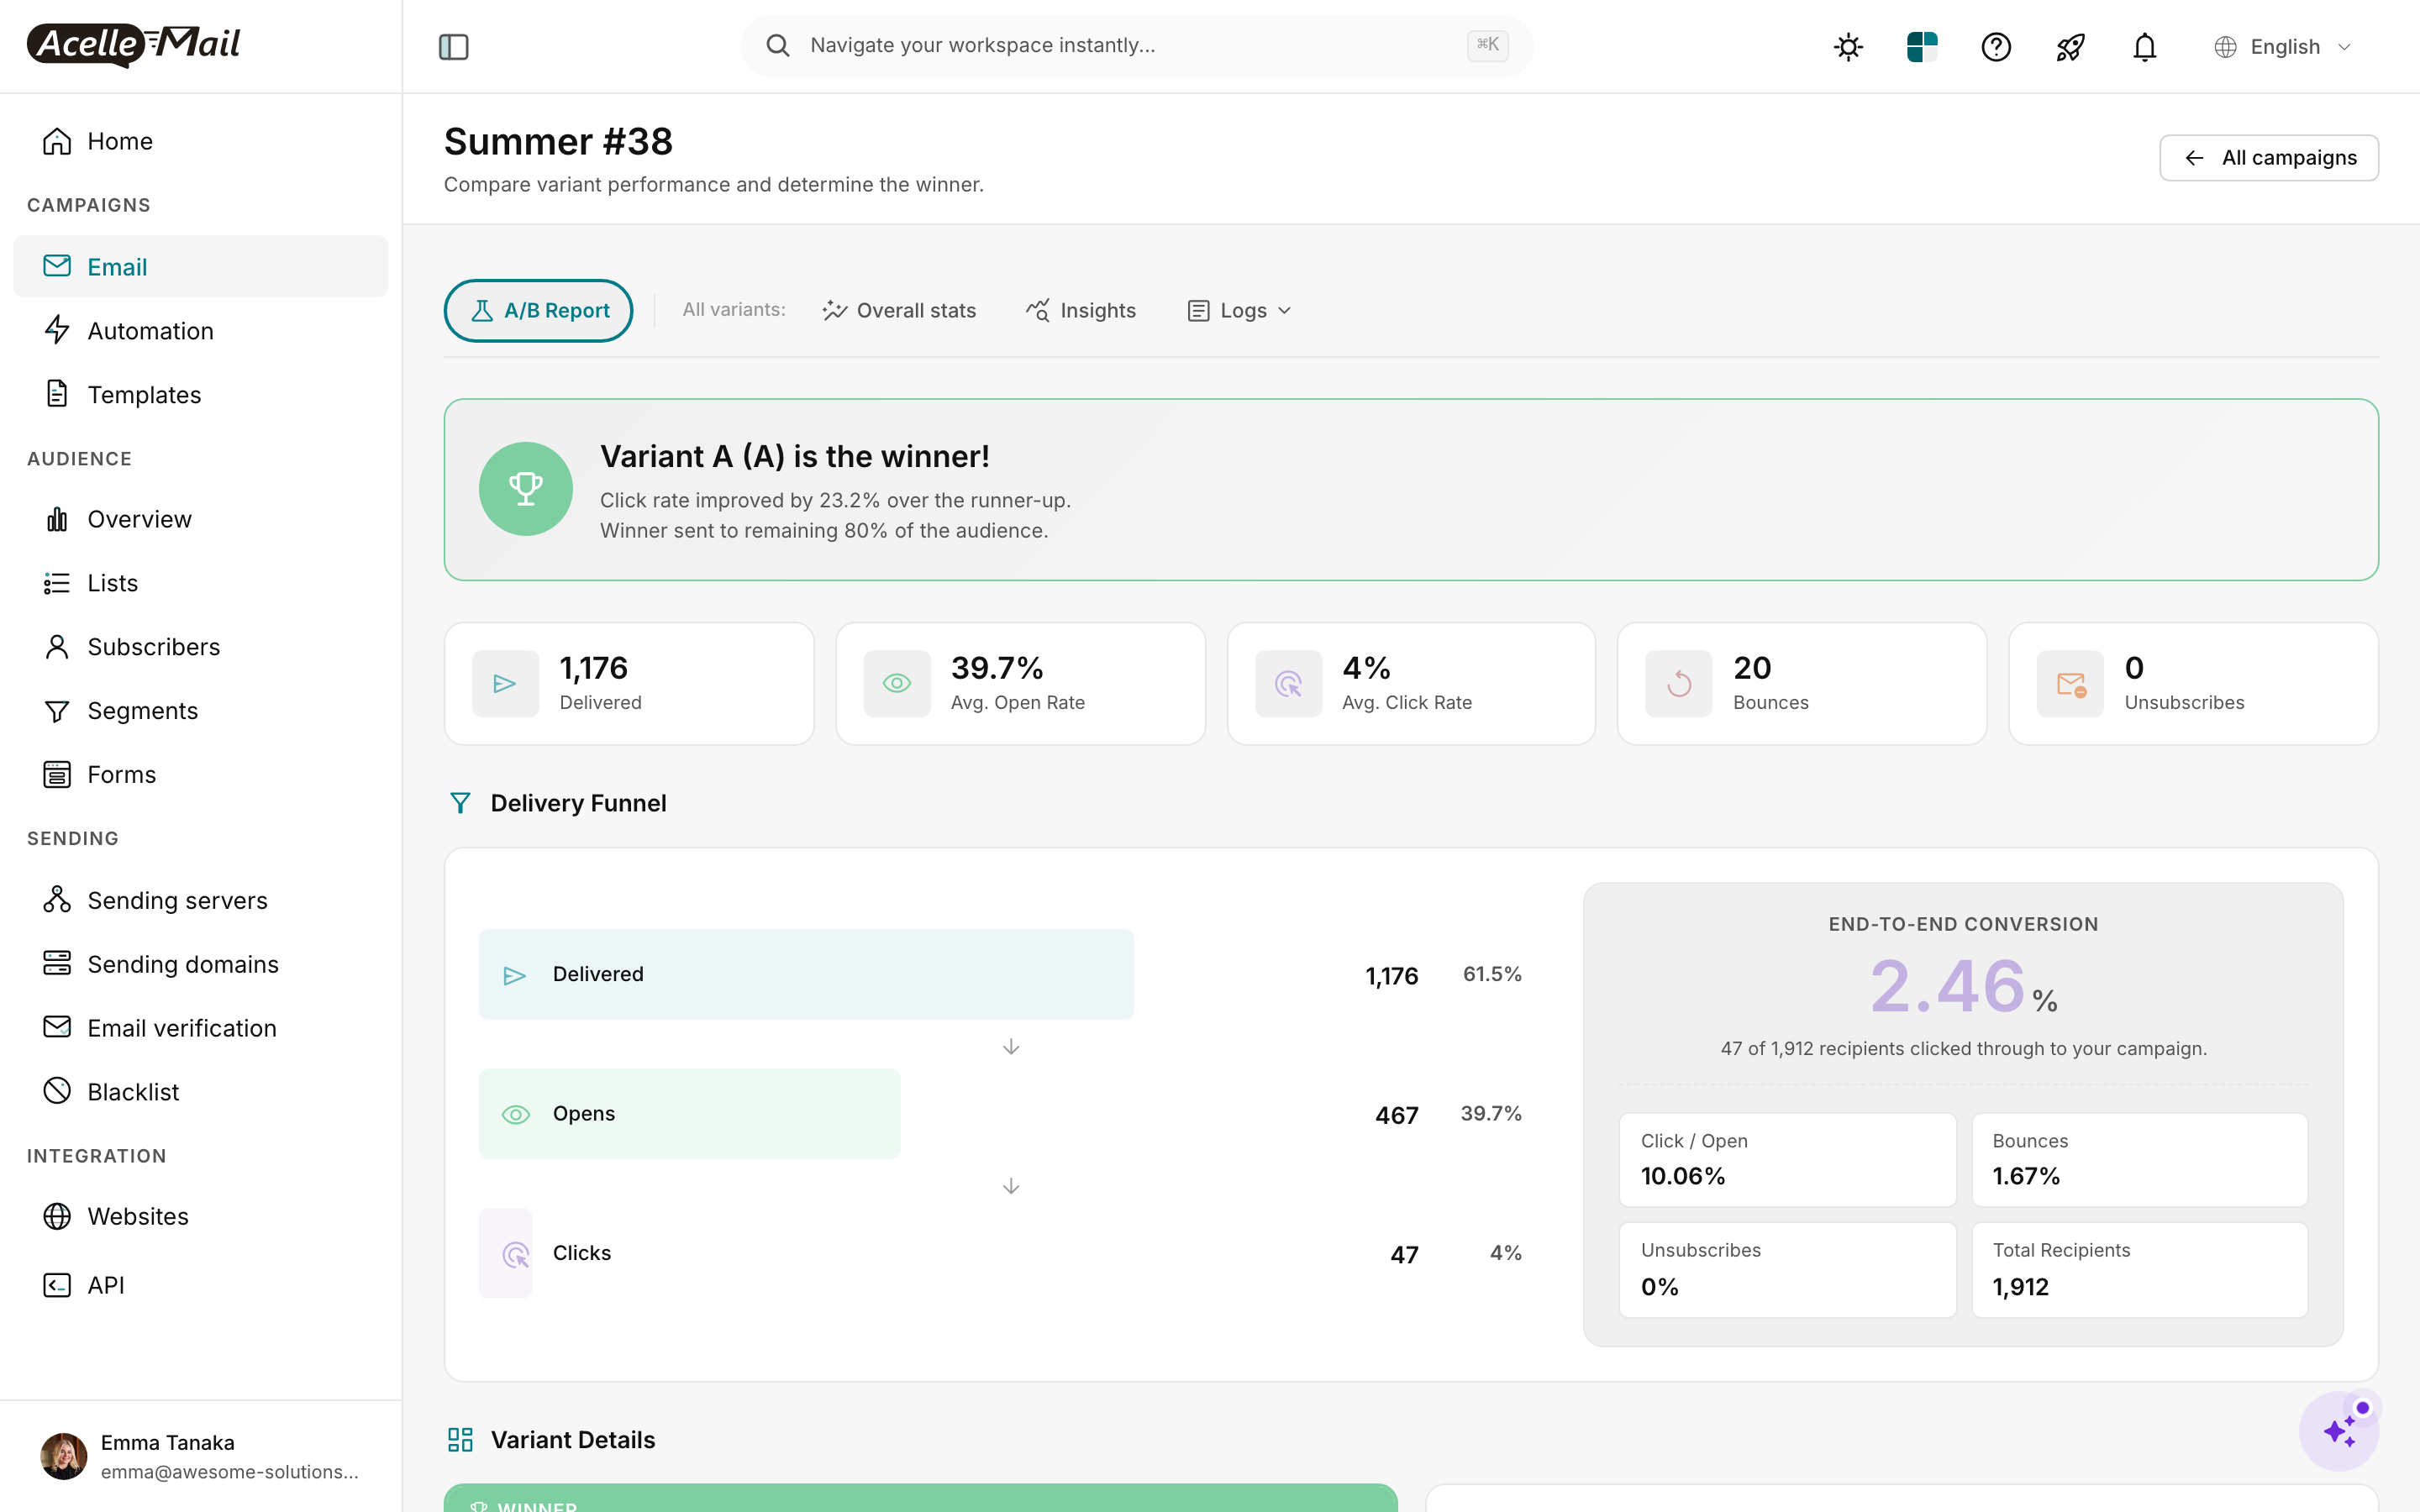
(Screenshot from A/B Test Campaigns article.)
The report has 5 tabs of its own:
| Tab |
What's there |
| A/B Report |
Winner banner + headline stats + delivery funnel |
| All variants |
Side-by-side per-variant numbers (Variant A vs B side-by-side) |
| Overall stats |
Combined numbers across all variants |
| Insights |
AcelleMail's plain-language read |
| Logs |
Per-recipient detail |
The most decisional view is All variants — that's where you compare A vs B directly.
Reading the winner banner#
The green winner banner is AcelleMail's verdict + the headline improvement. Three parts:
"Variant A (A) is the winner!
 Click rate improved by 23.2% over the runner-up.
 Winner sent to remaining 80% of the audience."
| Phrase |
What to verify |
| "Variant A is the winner" |
Match the variant label (A/B/C…) to what you actually tested. Notes in the setup tab tell you which variant had which subject/from-name. |
| "improved by 23.2% over the runner-up" |
The percentage delta between winning and runner-up variants on the chosen metric. NOT the absolute rate. |
| "Winner sent to remaining 80%" |
Confirms the rollout happened automatically (or didn't, if "Manual selection" was picked). |
Is the delta statistically significant?#
A "23.2% improvement" sounds great until you realize the test audience was 50 subscribers. Then it's noise.
Rough thresholds for trust (no formal statistical test — just decision rules that work):
| Test audience size per variant |
Trust delta if |
| <100 |
Don't trust any delta. Need bigger test. |
| 100-500 |
Delta must be >15% AND consistent direction across opens + clicks |
| 500-2,000 |
Delta >7% likely real |
| 2,000-10,000 |
Delta >3% probably real |
| >10,000 |
Delta >1.5% reliably real |
In the screenshot example: 1,176 delivered / 467 opens / 47 clicks. The test audience was ~600 per variant (1,176 total / 2 variants). At that size, 23.2% delta is reliable.
For a precise check, plug the numbers into any online A/B test calculator (search "A/B test significance calculator"). 95% confidence is the standard bar. Below 90% confidence, don't act on it.
The "All variants" tab — the data that matters#
This is where you compare variants side-by-side. For each variant, you see:
| Metric |
What it means |
| Delivered |
How many emails arrived (same-ish across variants since split was random) |
| Open rate |
% opened (caveat: Apple MPP inflates) |
| Click rate |
% clicked (the reliable metric) |
| Click-to-open rate (CTOR) |
% of openers who clicked — best content-quality signal |
| Bounces |
Should be similar across variants |
| Unsubscribes |
If one variant has 2x the unsubs, that variant alienated subscribers |
The 4 patterns you'll see:
| Pattern |
Reading |
| Variant A: higher opens AND higher clicks |
Clear winner. Subject + content both worked. |
| Variant A: higher opens, similar clicks |
Subject pulled more opens but content didn't capitalise. A is "better" if your KPI is opens; B is "as good" if your KPI is clicks. |
| Variant A: similar opens, higher clicks |
Subject was tie; B's content/CTA underperformed. The subject didn't matter; the content did. |
| Variant A: lower opens, higher clicks |
Counter-intuitive — A had a smaller, more engaged audience. Often happens with personalisation tests. |
What to do per verdict#
Winner (clear, statistically significant)#
✅ Promote the winning pattern. Update your subject-line / CTA / from-name standards to match.
Next test: vary a DIFFERENT element. If you tested subject lines this time, test CTA copy or send time next.
Inconclusive (delta <5%, low confidence)#
⚠️ Both variants performed similarly. Don't conclude anything — the test didn't have enough power.
Next test: increase the test audience size (from 20% to 40%), OR test a more dramatically different variation.
Loss (variant B significantly underperformed A)#
✅ Also valuable! You learned what NOT to do. Cross-reference variant B's pattern against your "stuff that didn't work" notes for future reference.
Next test: test the next hypothesis — don't keep beating up variant B.
Surprise (a variant you thought would lose actually won)#
⚠️ The most valuable result. Audit WHY:
- Subject line surprised? Maybe length / formality / emoji preference shifted
- From-name surprised? Maybe personal-name-vs-brand norms shifted
- CTA surprised? Maybe your offer messaging needs an update
Surprises are where you learn the most about your audience.
Statistical-significance worked example#
Setup:
- Variant A subject: "5 things every marketer should do this quarter"
- Variant B subject: "Q2 newsletter"
- Audience: 10,000, 50/50 split
- Metric: click rate
Result after 72h:
|
Delivered |
Opened |
Clicked |
CTR |
| Variant A |
4,820 |
1,690 (35.1%) |
145 (3.01%) |
— |
| Variant B |
4,810 |
1,500 (31.2%) |
115 (2.39%) |
— |
CTR delta: (3.01% − 2.39%) / 2.39% = +25.9% relative improvement for A.
At ~4,800 per variant with 145 vs 115 clicks, this is well above the 95% confidence threshold (any decent calculator confirms ~99.5% confidence).
Verdict: ship Variant A as the winning subject pattern. Next test: hold the subject style; vary the CTA copy.
Common pitfalls#
| Pitfall |
What's wrong |
Fix |
| Calling a winner at 12 hours |
Most opens land in the first hour but late-opens skew CTR. Wait the configured period (24-72h). |
Patience. The wait period is calibrated. |
| Testing 4 things at once |
Subject + sender + content + send time — you don't know which moved the needle. |
One variable at a time. |
| Re-testing the same hypothesis 3 times in a row |
Diminishing returns; audience may also adapt. |
Pick a different lever per quarter. |
| Ignoring unsubscribe rate |
A variant with higher clicks AND higher unsubs is poisoning long-term LTV. |
Treat unsubscribe rate as a guard metric — never let the winner have 2x the unsubs. |
| Manual-selection bias |
When picking manual winner, you choose the variant you predicted, regardless of data. |
If using manual, document the prediction BEFORE seeing data; compare. |
| Testing on a small list (<2,000) |
No statistical power. Even big deltas are noise. |
Pause testing on small lists; rely on industry benchmarks or test pooled across campaigns. |
What to log per test (a running playbook)#
Maintain a doc tracking every A/B test. Each row:
| Field |
Example |
| Date |
2026-05-19 |
| Campaign |
Spring Sale 2026 |
| Variable tested |
Subject line length |
| Variant A |
"5 things every marketer..." (45 chars) |
| Variant B |
"Q2 newsletter" (13 chars) |
| Winner metric |
Click rate |
| Winner |
A (3.01% vs 2.39%, +25.9%) |
| Confidence |
~99.5% |
| Decision applied |
Use long-descriptive subjects going forward |
| Re-test in |
Q3 2026 |
After 10-20 tests, patterns emerge — "our audience consistently prefers question-format subjects on Tuesdays." That's the real long-term value.
Related articles#
