What this is for#
Email ROI is the metric that justifies the channel. "Open rates are up" is interesting; "every dollar spent on email returns $42" is the conversation you have with your finance team. This guide shows the actual math, the AcelleMail data that feeds it, and the costs people forget to count.
The formula#
ROI = (Revenue from email − Cost of email) / Cost of email × 100
Multiply by 100 to express as a percentage. 300% ROI means every $1 spent returned $3 in profit. −50% ROI means every $1 spent lost 50¢.
Revenue — pull from your store, not from AcelleMail#
AcelleMail tells you how many clicks happened. Your e-commerce store / CRM tells you how many of those clicks converted into purchases. The reliable path:
- Tag every email link with UTMs (UTM Parameters article)
- Your store records
utm_campaign on every order (Shopify, WooCommerce, Stripe, etc. all support this natively or via plugin)
- Filter orders by the campaign's UTM to get revenue attributable to that campaign
Without UTMs, you cannot reliably attribute revenue to specific campaigns — "email referrals" in Google Analytics is too coarse. Set up UTMs first.
Attribution windows — pick one and stick#
Same campaign drives revenue over time. You need a rule for when to "stop" counting.
| Window |
What it captures |
Best for |
| Click → 1 hour |
Direct, immediate purchases |
Flash sales |
| Click → 24 hours |
Same-day conversions including comparison shopping |
Most consumer campaigns |
| Click → 7 days |
Considered purchases, multi-touch |
B2B / high-ticket |
| Click → 30 days |
Full LTV influence |
Long-cycle products |
For most consumer emails, 24-hour attribution is the right default. For B2B / SaaS, 7-day. Pick a window per industry and apply it consistently — comparing 24-hour ROI on one campaign to 30-day ROI on another is misleading.
Cost — the components people forget#
Email feels "free" because there's no per-email cost (unlike paid ads). But there's a real cost stack:
| Cost component |
Typical range |
Why people miss it |
| AcelleMail subscription / hosting |
$20-200/month |
Fixed cost, but real |
| Sending server fees (SES, SendGrid, etc.) |
$0.10-1.00 per 1,000 emails |
Variable, ignored if low |
| Design time (template + email creation) |
2-8 hours per campaign × hourly rate |
"Internal" so feels free |
| Copy / strategy time |
1-4 hours per campaign |
Same |
| List management (segmentation, cleaning) |
2-5 hours/month |
Spread across all campaigns |
| Image / asset purchase |
$0-100 per campaign |
Often ignored if reusing stock |
| Tooling (verification service, deliverability monitoring) |
$0-500/month |
Subscription that "just runs" |
A campaign's fully-loaded cost — not just the send fee — is what you divide revenue by.
A worked example#
| Item |
Cost |
| Pro-rated AcelleMail subscription (1 campaign out of 4 monthly) |
$25 |
| Sending fees: 10,000 emails × $0.30/1k |
$3 |
| Designer's time: 4 hours × $50 |
$200 |
| Copywriter's time: 2 hours × $60 |
$120 |
| Total cost |
$348 |
Campaign drove $2,800 revenue (40 orders × $70 avg, attributed via UTM utm_campaign=spring_sale_2026 filter in store).
ROI = ($2,800 − $348) / $348 × 100
    = $2,452 / $348 × 100
    = 705%
Each $1 returned $7.05. Strong campaign.
Reading AcelleMail's numbers in context#
AcelleMail's campaign report doesn't show revenue — that's intentional (it doesn't know what each subscriber did at your store). But it gives you the clicks that feed the calculation:
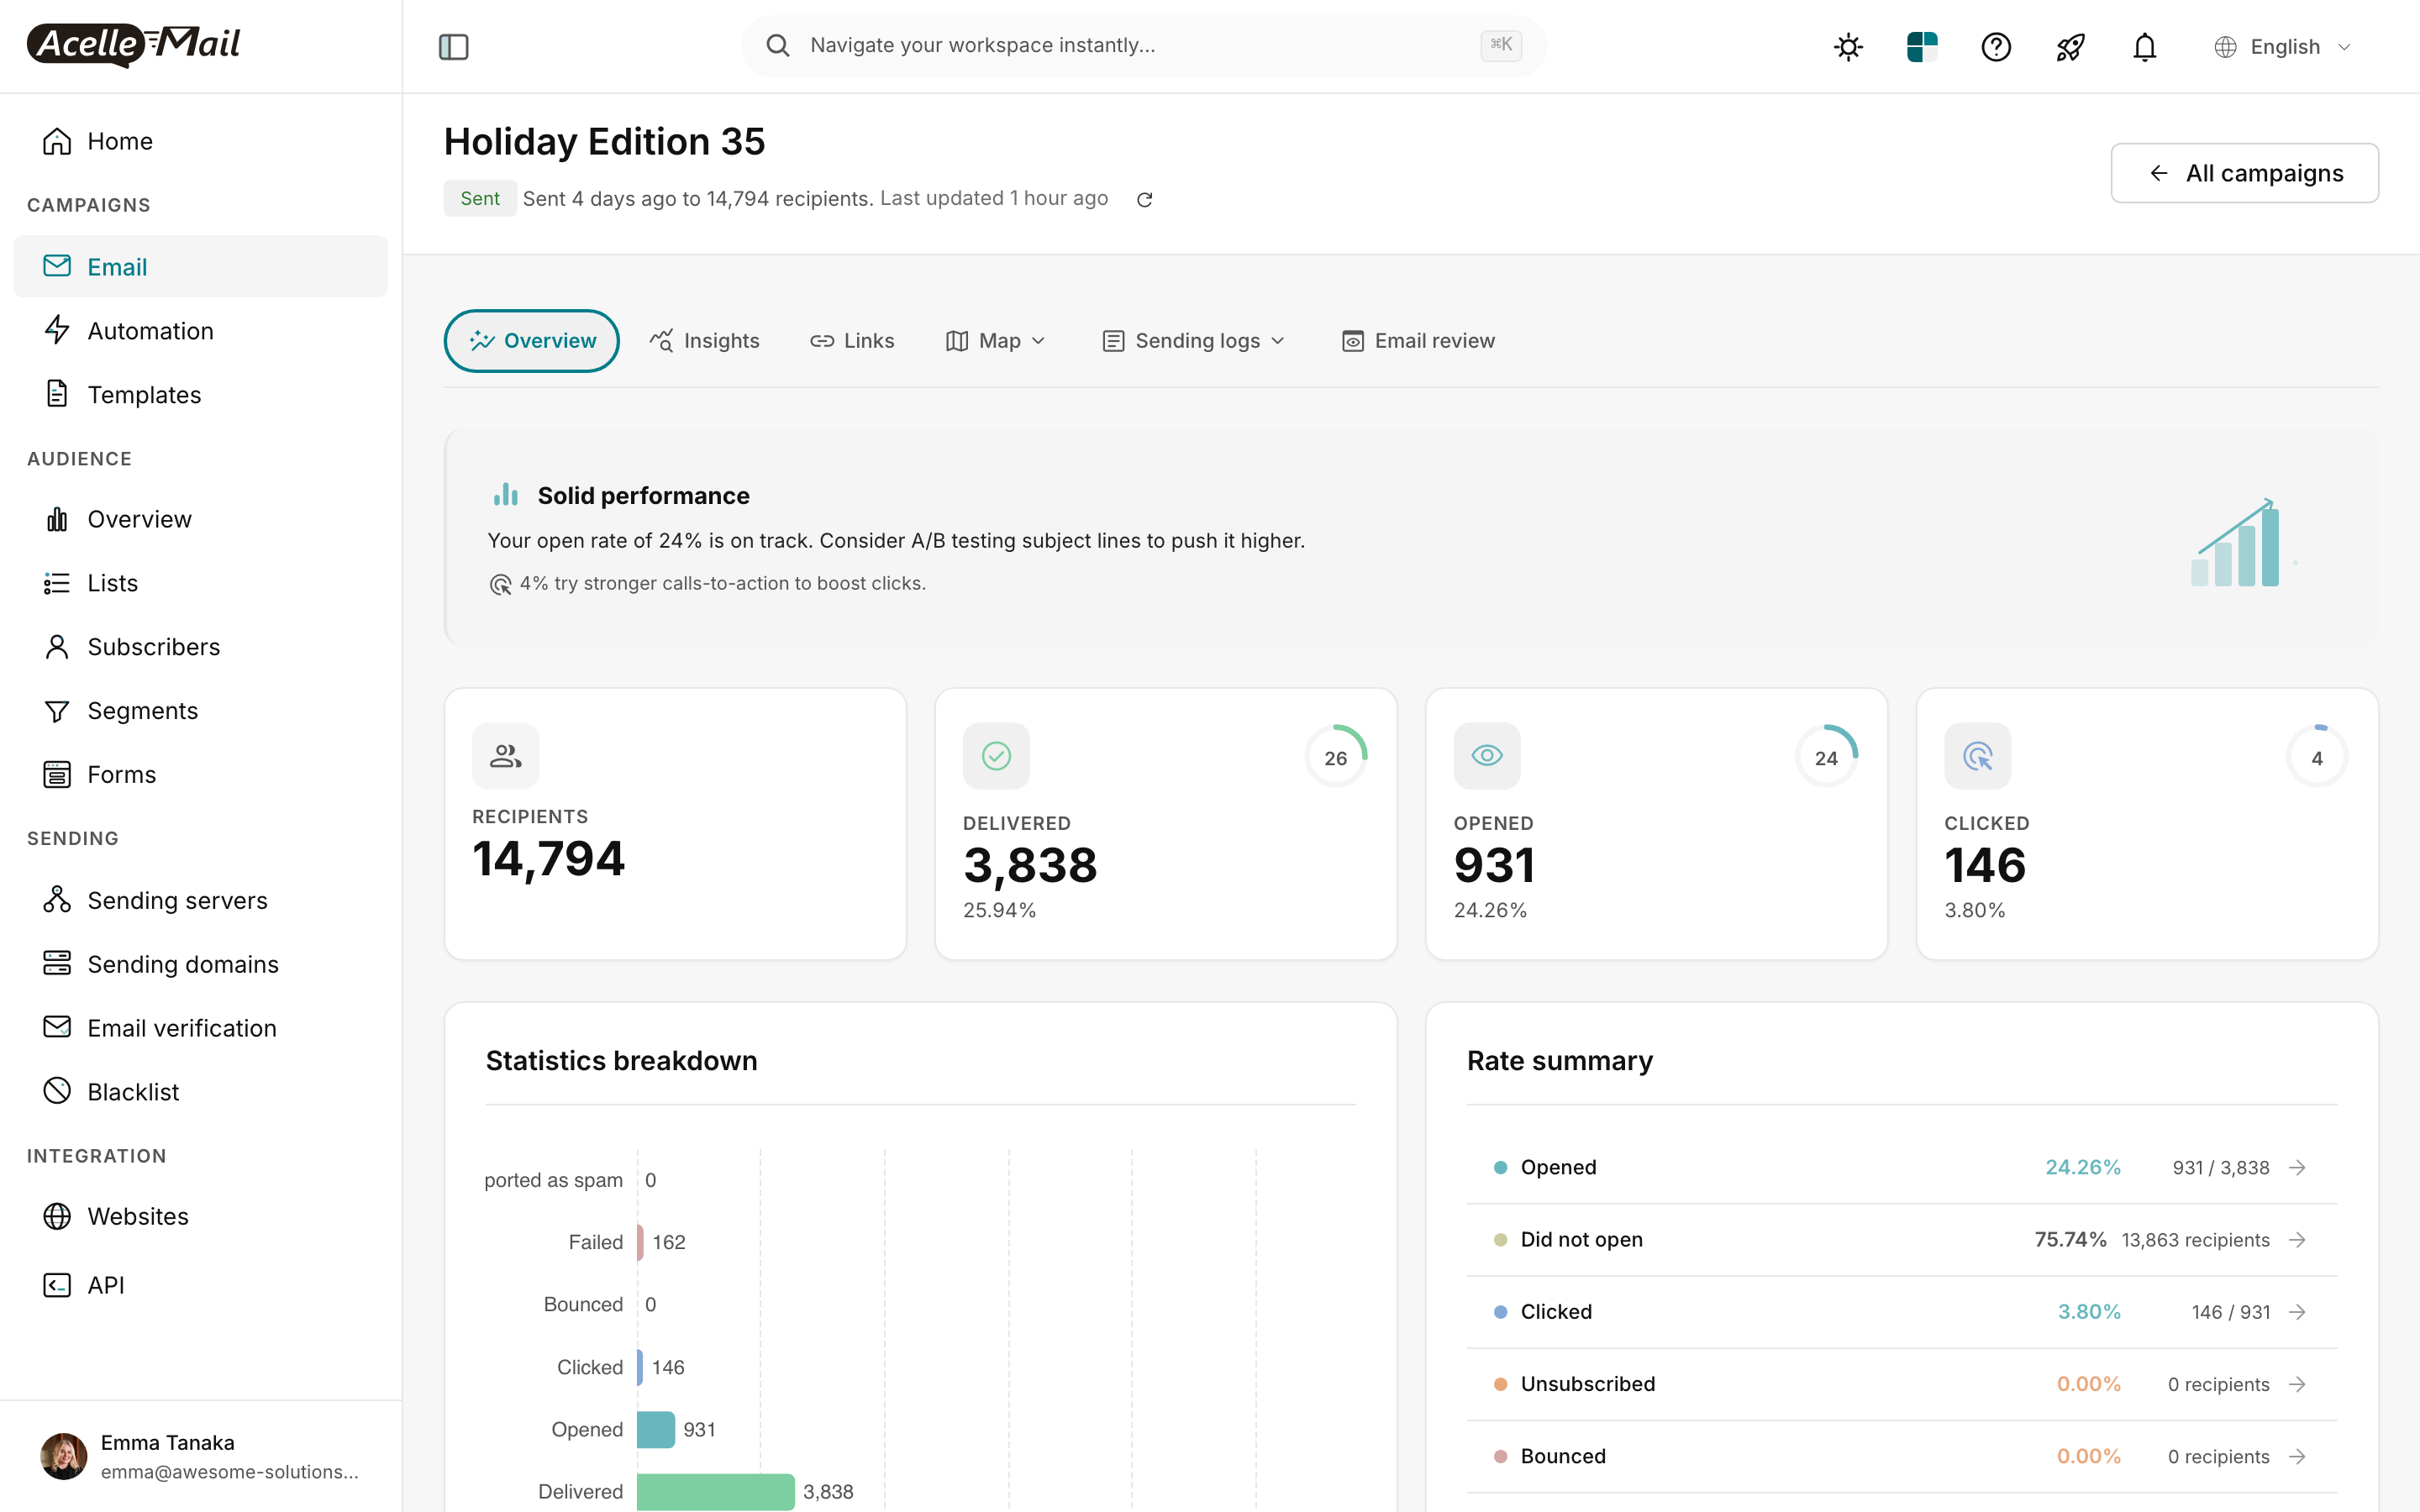
(Screenshot from Read the Campaign Report.)
The flow:
- AcelleMail says: 146 unique clicks across X UTM-tagged URLs
- Your store says: 12 orders had
utm_campaign=spring_sale_2026 in the last 24 hours, totalling $840
- You compute: ROI = ($840 − $52 cost) / $52 × 100 = 1,515%
Cross-checking: 146 clicks → 12 orders = 8.2% click-to-order conversion rate. That's healthy (typical 3-15% for warmed audiences). If you see <1%, something's off — bad landing page, mismatch between subject promise and offer, etc.
Per-campaign vs per-subscriber-per-year#
Two ways to look at email ROI:
| View |
When to use |
Calculation |
| Per-campaign ROI |
Evaluate a single send |
Revenue from this campaign / Cost of this campaign |
| Per-subscriber-per-year (RPY) |
Evaluate the whole program |
Total annual revenue / Subscribers on list |
A subscriber whose lifetime value (LTV) is $500/year contributes — across all the campaigns they receive — that $500. If your list is 10,000 subscribers and your annual email revenue is $1,200,000, your RPY = $120/subscriber/year.
| RPY |
Diagnosis |
| $50-100 |
Solid B2C program |
| $100-300 |
Strong; doing many things right |
| $300-1,000+ |
Best-in-class (high-LTV products, well-targeted lists) |
| <$25 |
Either low-LTV product OR list is mostly inactive — run re-engagement |
Per-campaign ROI tells you which campaigns to repeat. RPY tells you whether the entire email program is worth investing in.
Hidden non-revenue value#
ROI is one number, but email drives outcomes that don't show up as direct revenue:
| Hidden value |
How to estimate |
| Brand recall / re-purchases |
RPY captures some of this |
| Customer support deflection ("How do I…?" emails answered preemptively) |
Survey CSAT post-campaign |
| Referrals generated by satisfied subscribers |
Track refer-a-friend codes |
| Reduced churn (subscribers who stayed because the email reminded them you exist) |
A/B test sending vs not sending for a quarter |
Include these qualitatively when defending the email budget — "ROI is 700% direct, plus reduced churn by 12%".
Improving ROI#
Three buckets of improvement, ranked by leverage:
| Bucket |
Impact |
Effort |
| Reduce send cost |
Low — already cheap |
Switch to cheaper sending server only if usage is heavy |
| Increase conversion rate |
High — better targeting, copy, offer |
Focused A/B testing |
| Increase list quality |
Highest — better subscribers → higher RPY |
List hygiene + reduced churn |
Don't optimise cost first. Email is one of the cheapest marketing channels by far. The leverage is in conversion + list quality.
Common issues#
| What you see |
What to do |
| Reported revenue doesn't match what store thinks |
Attribution window mismatch. Confirm both sides use the same window. |
| ROI looks great but business isn't growing |
You're cannibalising organic / direct traffic (same customers would have bought without email). Run a holdout test: don't email 10% of the audience, compare conversion rates. |
| AcelleMail says 200 clicks, store says only 50 referrals |
Most likely UTMs got stripped somewhere (browser tab restore, social-share rewrites). Audit step-by-step using UTM Parameters article §5. |
| ROI calculation says 4,000% (suspiciously high) |
You probably under-counted costs. Add design + copy hours; recompute. |
| ROI looks negative — should we stop emailing? |
NO — at least not based on one campaign. Look at trailing 3-month avg + RPY before pulling the plug. |
A weekly / monthly review template#
For a sustainable email program, run this review on a Friday afternoon:
| Question |
Where to look |
| What was last week's per-campaign ROI? |
Store's UTM-filtered revenue / cost |
| What's our 3-month average ROI? |
Same, rolling |
| What's our current RPY? |
Annual revenue / subscriber count |
| Which campaign type drove the highest ROI? |
Cross-reference with category tags |
| Which subscribers have we never converted? |
Re-engagement article candidates |
Related articles#
