What this is for#
Your AcelleMail open-rate number is wrong. Not because AcelleMail is broken — because Apple Mail Privacy Protection (MPP) pre-fetches the tracking pixel that every ESP uses to record opens. Every email delivered to an MPP-enabled inbox registers as "opened" the moment Apple's proxy fetches it, regardless of whether a human ever read it.
This article shows how to spot MPP inflation in AcelleMail's reports, what an "open" actually means now, and which metrics to optimise instead.
What MPP does (and why it kills open tracking)#
Since iOS 15 (September 2021), Apple's mail apps automatically:
- Pre-fetch every image in an email — including the invisible 1×1 tracking pixel that ESPs use to count opens
- Route the fetch through Apple proxies — so the IP / location AcelleMail records is Apple's data center, not the user's device
- Pre-fetch on delivery, not on user-open — so the open registers BEFORE the user has even seen the email (or ever will)
Result: every campaign sent to an Apple Mail user with MPP enabled records as opened. Open rates look fantastic. They aren't.
How widespread#
By industry rough numbers:
| Segment |
Share of all email opens (approx.) |
MPP-affected |
| Apple Mail (iOS + macOS) |
35-50% |
80-90% of these |
| Gmail |
25-35% |
Not MPP-inflated (own tracking) |
| Outlook desktop + web |
10-20% |
Not MPP-inflated |
| Yahoo / AOL / Others |
5-15% |
Not MPP-inflated |
The math: if Apple Mail is 45% of your audience and 85% of those have MPP, then ~38% of your "opens" are MPP-inflated. Your real engagement is significantly lower than the dashboard suggests.
The exact ratio depends on your audience:
- Consumer / lifestyle / mobile-first lists — skew heavily Apple, expect 40%+ MPP inflation
- B2B / enterprise lists — skew Outlook, expect <15% MPP inflation
- Mixed audience — split roughly to the industry average above
How to spot MPP inflation in AcelleMail#
There's no direct "MPP filter" toggle in the refactor UI, but the open log tells you exactly what's happening: every open is logged with the IP address that fetched the pixel. Apple proxies have telltale IP ranges.
Open any sent campaign → Sending logs tab. (Or directly: /campaigns/{uid}/open-log.)
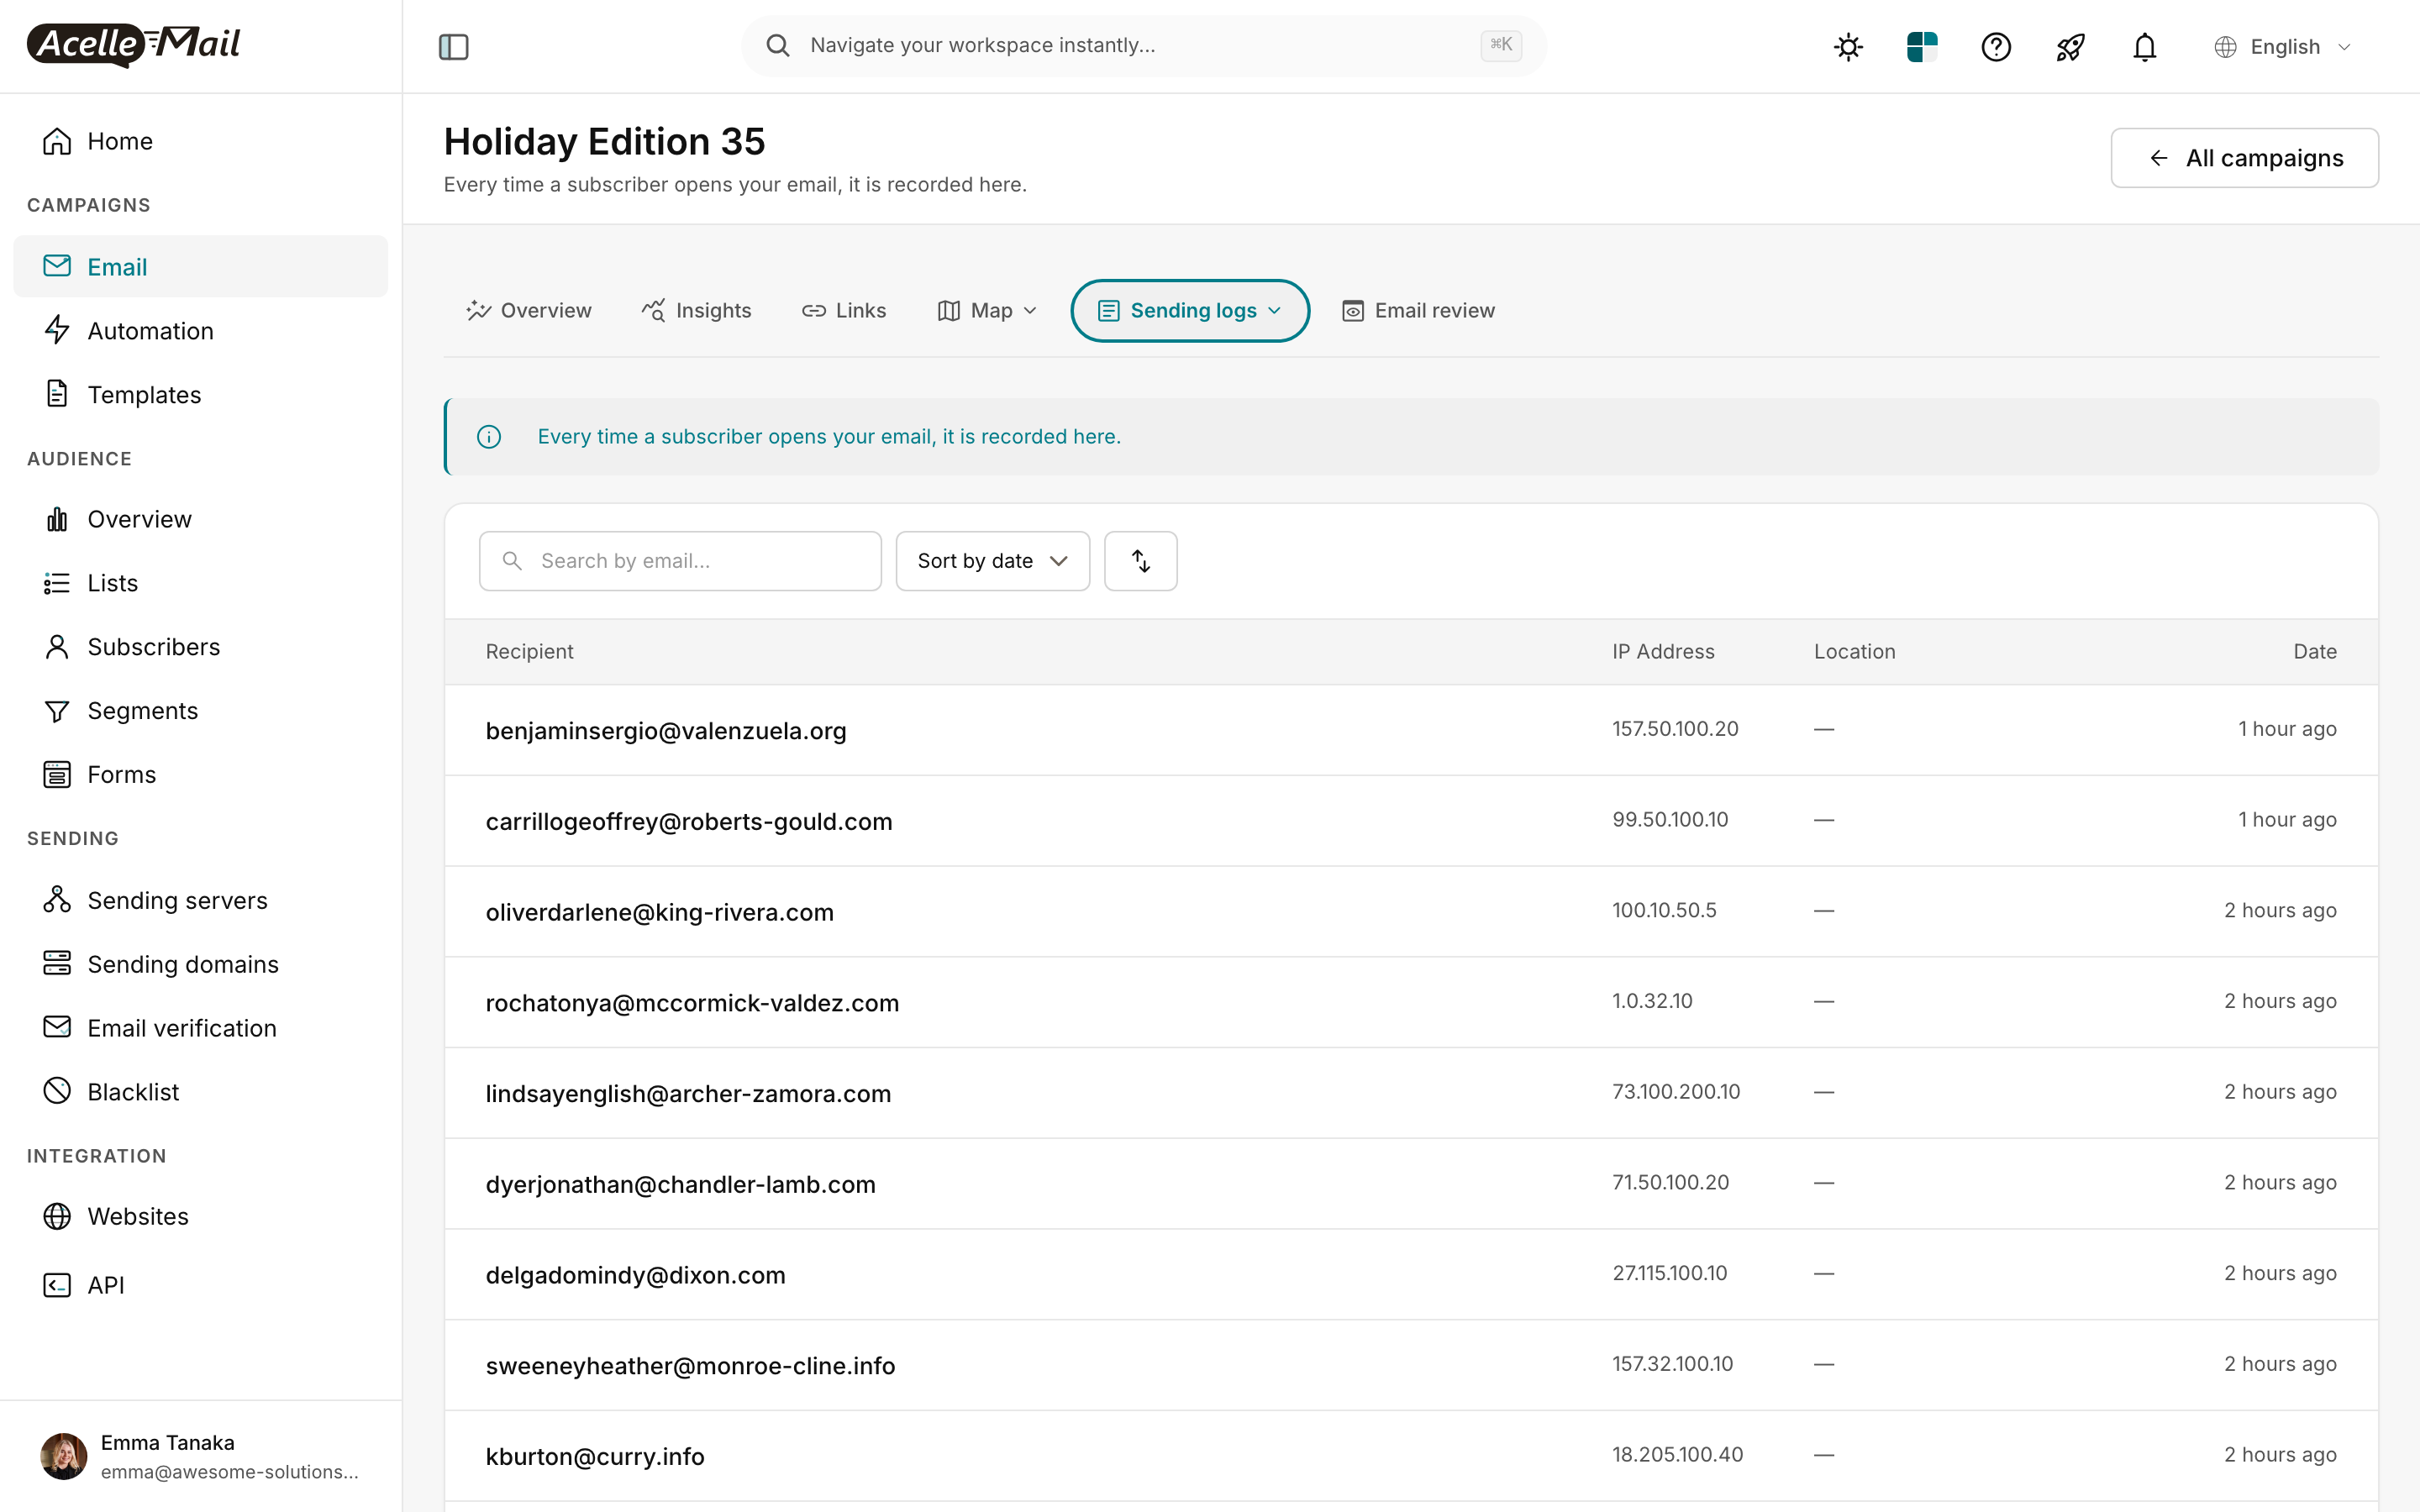
What to look for:
- Location column showing "—" (no city) — strong signal of Apple proxy
- Date clustering — many opens recorded within 1 minute of each other, hours apart from when the user is plausibly awake — pre-fetch behaviour, not human behaviour
- Many opens from a small set of IP ranges — Apple uses a finite pool of proxy IPs; you'll see the same IPs across hundreds of subscribers if MPP is heavy
If 30-50% of opens have the "—" location pattern + cluster suspiciously, roughly that share is MPP-inflated. Subtract that mentally from your headline open rate to get a more realistic estimate.
What the Overview tab actually tells you#
When you read the campaign report, the headline number is no longer trustworthy on its own.
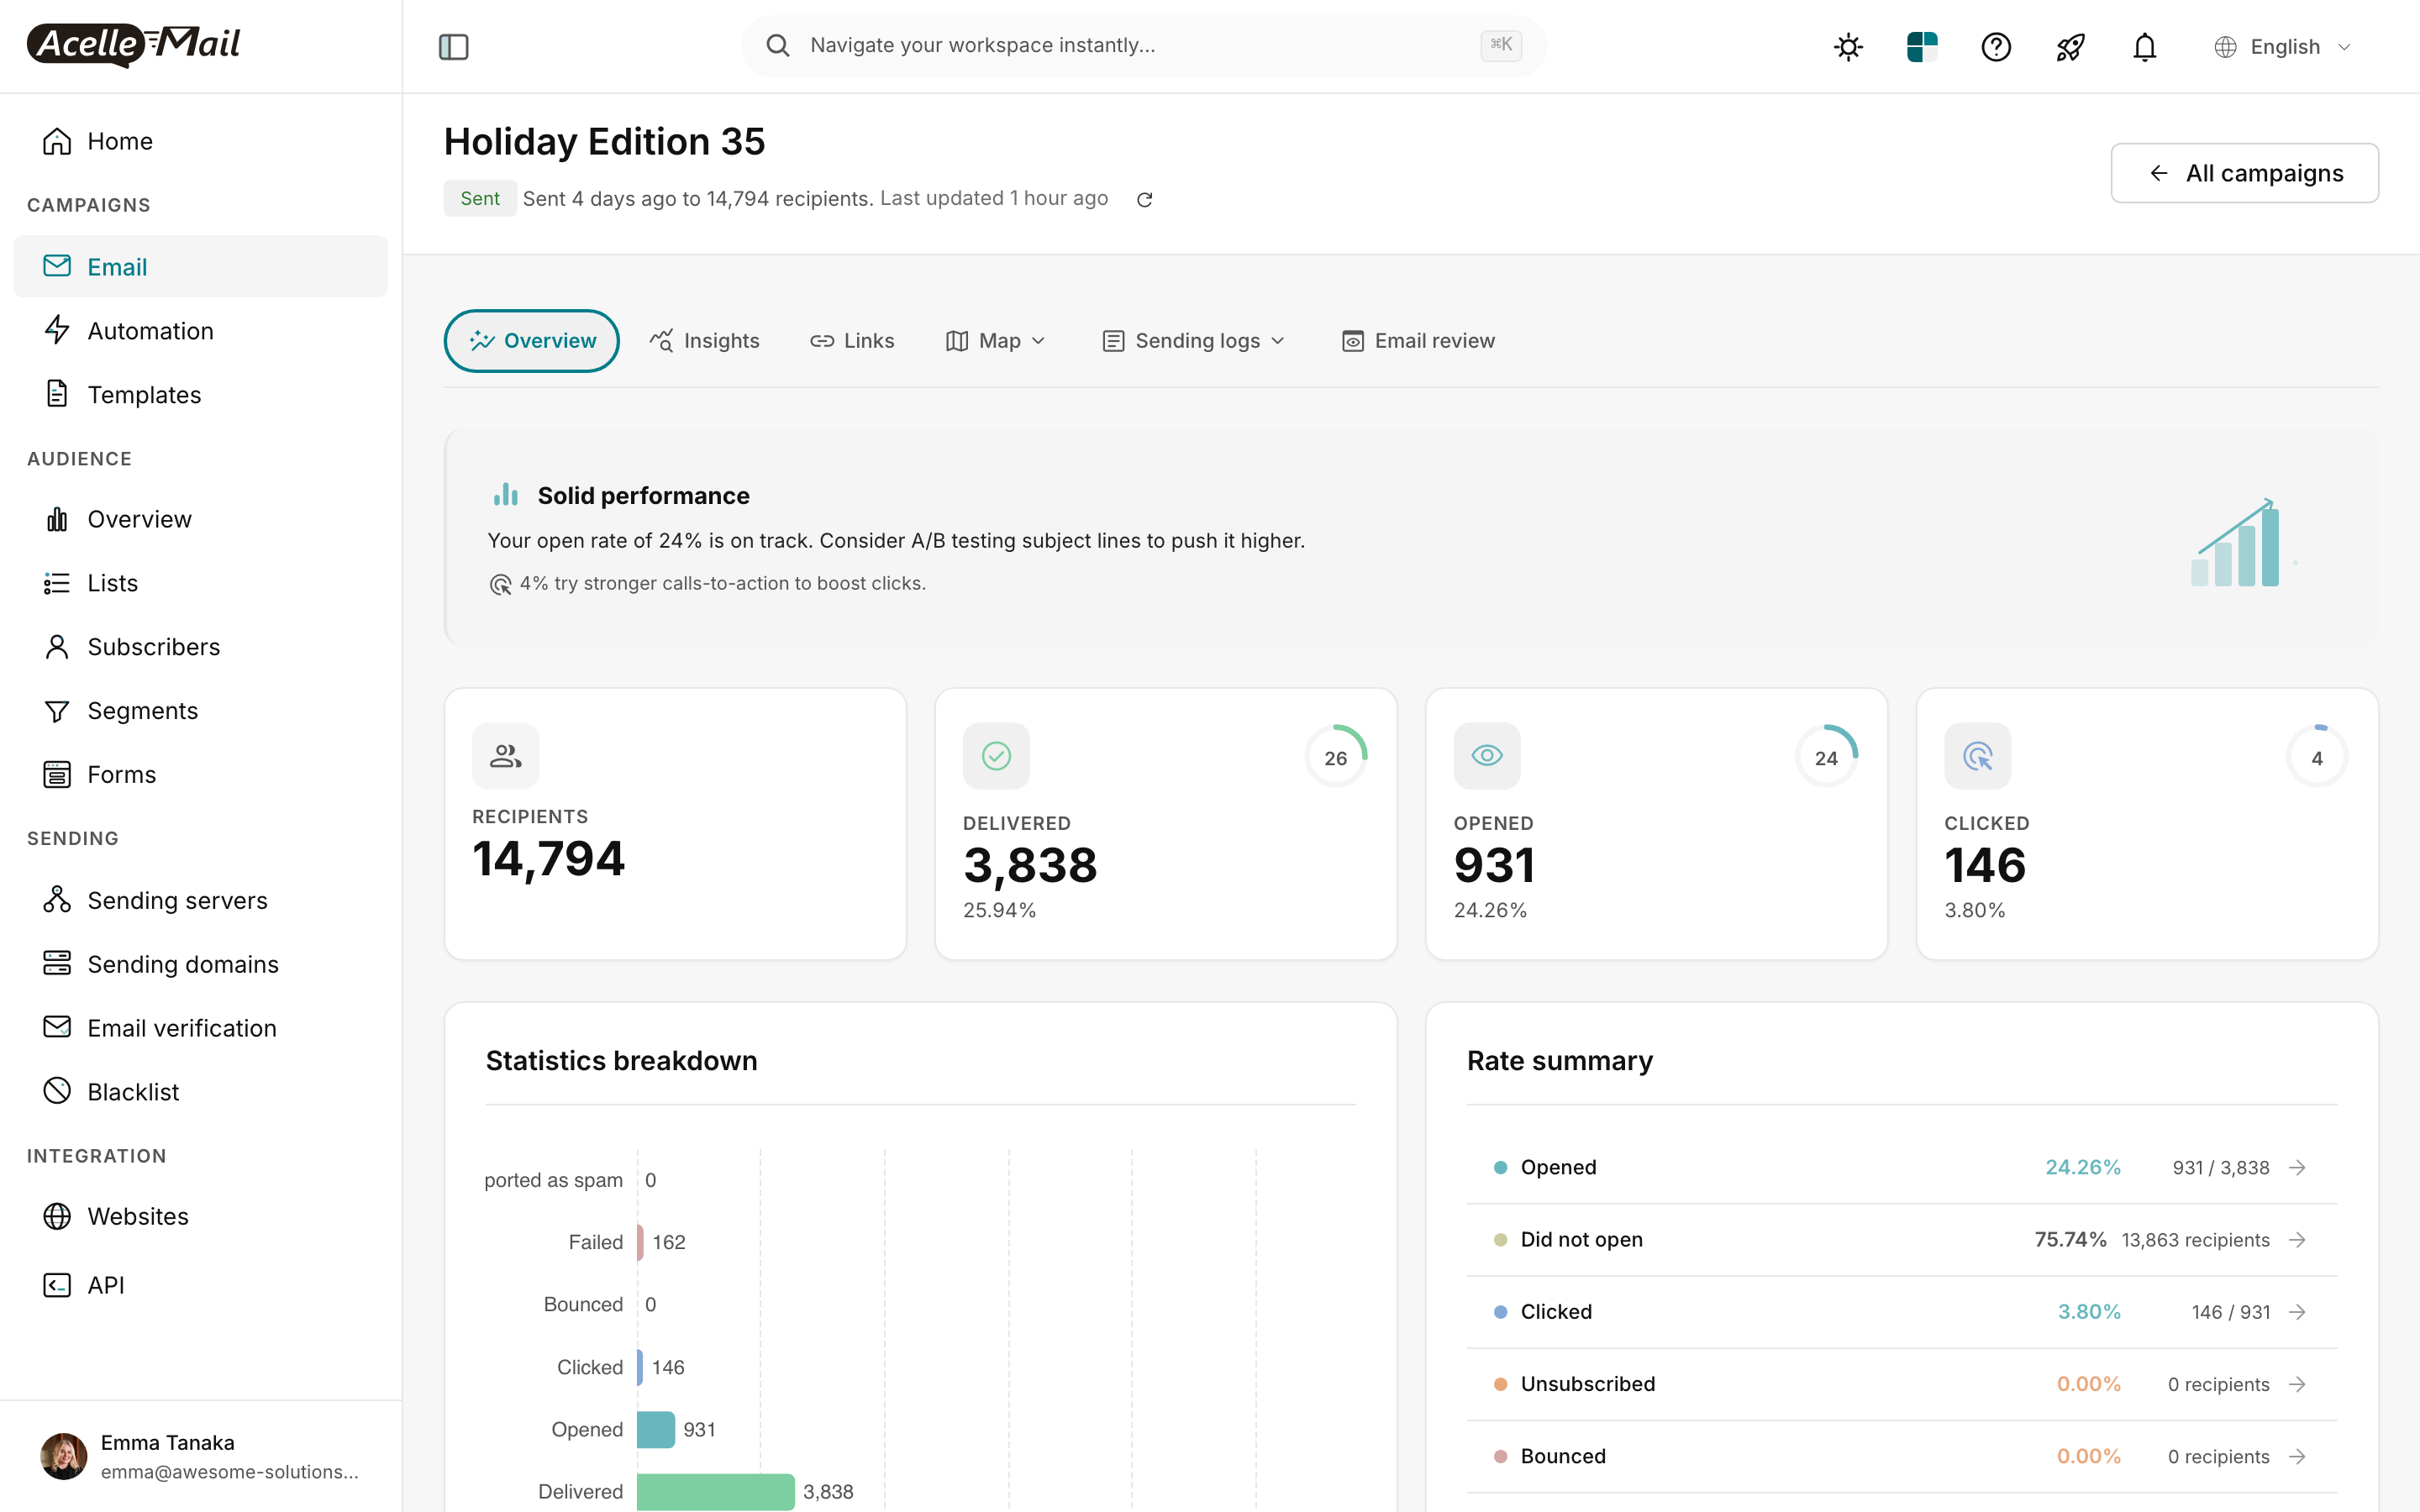
(Screenshot from Read the Campaign Report.)
For "Holiday Edition 35":
- Dashboard says: 24.26% open rate (931 of 3,838 delivered)
- MPP-adjusted (if 40% of audience is Apple): ~14-18% real open rate
- CTR (click rate) = 3.80% — this number is NOT MPP-inflated. Clicks require real human action.
The CTR is the reliable number. If you only look at one metric for engagement, click rate is the one.
What to measure instead#
The MPP era is forcing email marketers to shift to metrics that survive the inflation:
| Metric |
Why it survives MPP |
| Click rate (CTR) |
Clicks require a human tapping a link — pre-fetch doesn't trigger clicks |
| Click-to-open rate (CTOR) |
Less affected because clicks are real; the denominator (opens) is inflated, so CTOR appears lower than it should — but the metric is still comparable campaign-to-campaign |
| Revenue per recipient |
The only metric that matters commercially. Untouched by MPP. |
| Unsubscribe rate |
Real signal of fatigue / mismatch. Untouched by MPP. |
| Reply rate |
For 1-to-1 / sales emails — direct human engagement |
| Conversion rate (purchase, signup, etc.) |
The downstream business goal — what you actually optimise for |
Stop optimising for opens. Re-orient your A/B tests, your subject line decisions, and your dashboards around clicks + conversions. Open rate becomes a quick sanity check — "did anyone even see this?" — rather than the primary KPI.
How to adjust your A/B testing#
If you're running A/B tests on subject lines (see A/B Test Campaigns), the Winner Rules tab lets you pick the win condition:
| Choice |
Recommended? |
Why |
| Highest open rate |
❌ Not anymore |
MPP inflates both variants equally, but adds noise. Differences <5% are basically random. |
| Highest click rate |
✅ Yes |
Real signal. Use this for subject + content tests. |
| Manual selection |
✅ When testing revenue or conversion |
Pull data from your backend; pick the winner by what actually drove dollars. |
For most A/B tests in the MPP era, switch the winner metric from open rate to click rate by default.
How to read open rate when you can't avoid it#
Despite the inflation, you still have to report open rate to executives, comparison-shop campaigns over time, and benchmark against industry numbers. Three honest approaches:
- Report it as "raw open rate" + caveat. Add a footnote: "Open rate inflated ~30% by Apple MPP pre-fetch. CTR is the more reliable engagement metric."
- Report the trend, not the absolute number. If your open rate went from 24% to 32% campaign-over-campaign, that's still a real lift (assuming MPP share stayed constant). Trend > absolute.
- Build an "engaged opener" segment — subscribers who have clicked in the last 30 days. Their "open rate" in your analysis is a real human metric.
What to do, ranked by impact#
| Priority |
Action |
| 1 |
Switch primary KPI from open rate to click rate in dashboards |
| 2 |
Re-run A/B tests on subject lines using click rate as winner condition |
| 3 |
Build engagement-based segments off clicks, not opens |
| 4 |
Don't change re-engagement thresholds yet — using opens > 90 days for sunset still works because Apple subscribers' opens are consistently inflated; the relative comparison holds within a single subscriber's history |
| 5 |
Update internal reporting templates to caveat open rate |
What NOT to do#
- Don't compare your post-2021 open rates to pre-2021 numbers — they're not the same metric. You'll look like a hero or a failure for spurious reasons.
- Don't try to "filter out" MPP opens in AcelleMail. There's no reliable way to do this client-side; Apple intentionally mixes in real opens with prefetches.
- Don't switch ESPs hoping MPP will be solved. Every ESP has the same problem. This is industry-wide.
- Don't tell your team "open rate is dead." It's still useful as a directional / trend signal — just stop using it as your primary KPI.
Common questions#
| Question |
Answer |
| Will Google add similar MPP to Gmail? |
Hasn't yet (as of 2026). Gmail uses its own tracking that's more accurate than the pixel. |
| If MPP inflates everyone equally, isn't it still useful for comparing campaigns? |
Roughly yes — relative comparison within the same audience still works. But absolute numbers and benchmarks against industry are useless. |
| What about "Open Statistics → By Email Client" the docs mention? |
That UI path doesn't exist in the AcelleMail refactor UI. Use the Sending logs tab + Open log sub-view to see per-open IP / Location, which surfaces Apple-proxy patterns. |
| Should I switch to text-only emails to bypass tracking? |
Text-only emails have no images = no tracking pixel = AcelleMail can't measure opens at all. Useful for plain transactional, not for marketing. |
Related articles#
